Tutorial 1
Introduction
Coronary artery disease (CAD) is the most common type of heart disease. The Coronary Artery Disease (C4D) Genetics Consortium in 2011 (Coronary Artery Disease (C4D) Genetics Consortium et al., 2011) identified five loci newly associated with CAD. In one of these loci the genetic variant rs1412444 (with position 10:91002927 in the human genome build hg19) was the mostly associated variant (the variant with the lowest p-value in the locus). 10:91002927 has two alleles (C and T) and the allele T is associated with an increased risk for CAD.
We will search whether there are variants that are LD-overlapping with rs1412444 and are also associated with gene expression levels.
Step 1. Open the LD Browser
There are two options to open the LD Browser.

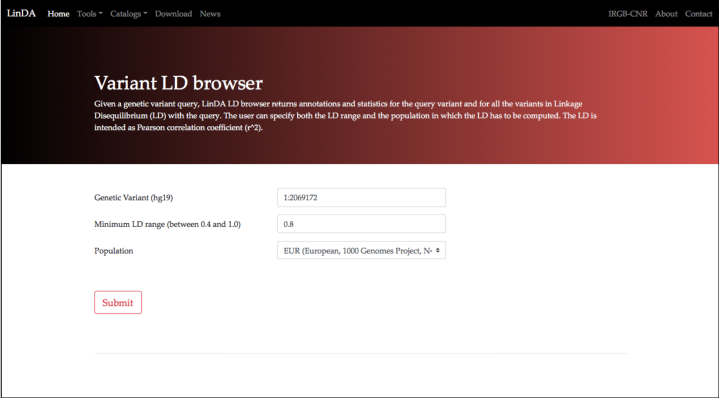
Step 2. Setup the query
The LD Browser query consists of 3 parameters
The first parameter is the genetic variant to be queries (i.e. rs1412444). The genetic variant must be supplied in the form of "chromosome:position", from the human genome build hg19 or GRCh37: hence in this case (do not insert chr10:91002927, chr10:91002927-91002927 or rs1412444: only 10:91002927 is allowed).
The second parameter is the LD cutoff. This is intended as values of Pearson Correlation Coefficient (r2). The LD Browser will search for all the variants with LD values larger than the cutoff. Only cutoffs with values ranging from 0.4 and 1.0 are allowed. A widely used cutoff in literature is the default value (0.8). We will keep this value in this example as well.
The third parameter is the human population in which the LD has to be computed. LinDA uses precompued LD values in different populations. Select the population from the window menu. In this case keep the default population: the european population, represented by the 503 european individuals of the 1000 Genomes Project.
Click on the Submit button to submit the query.
The LinDA LD Browser first indicates a summary of the query in the top of the web page.
It follows a table listing all the variants in LD with the query, the LD (in r2) and the link to the genomic position to the UCSC genome browser (human genome build hg19).
The table can be downloaded in CSV and EXCEL format.
The table can be searched for specific elements (e.g. a specific variant, try 10:91011681).

Scroll down the web page to find the second table outputted by the LD Browser.
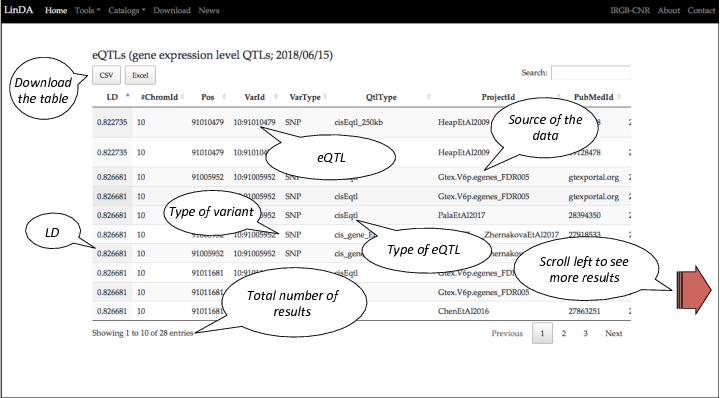
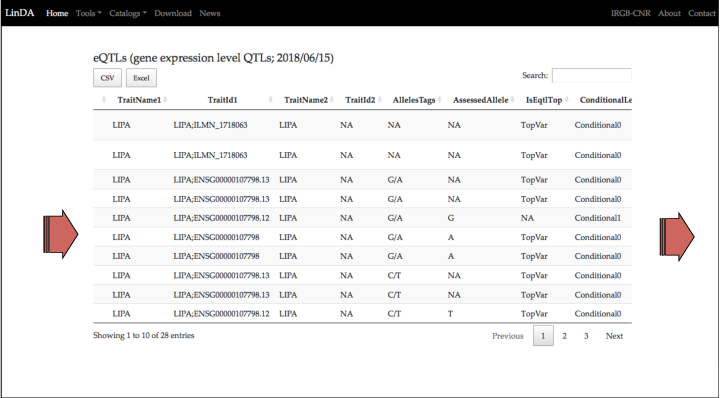
This is the table listing all the eQTLs variants in LD with the query.
The table can be downloaded in CSV and EXCEL format.
For each eQTL variant found in LD are reported several information of the eQTL: the first columns report the LD of the eQTL with the query; the chromosome; the position; whether is a SNP, INDEL or CNV; the source project and the PUBMED ID.
In this tutorial we will focus on the eQTL in the row 6 (the eQTL 10:91005952).
Scroll left the table to see other features or download the table to visualize it with your own favourite visualizer.
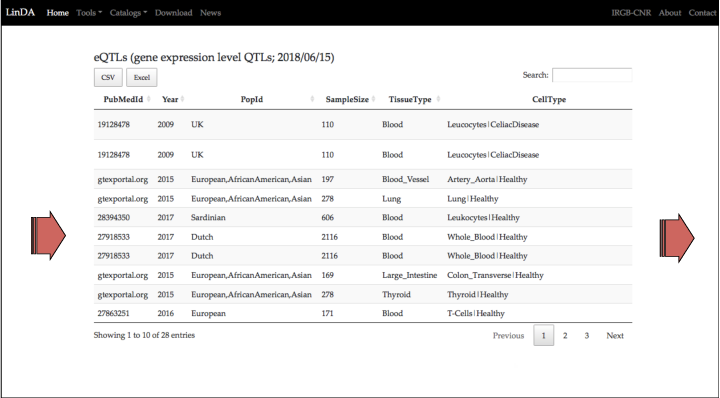
Beside the PUBMED ID, there are other details about the project/publication from which the eQTL was collected.
These include the year of publication, the population under study, the sample size, the tissues classification from which the RNA was extracted, and details about the cell type (including experimental conditions, i.e. stimulation of specific cell types wih molecules or drugs.)
TraitName1 and TraitId1 are the columns with the most important information about the expresion trait. In the case of the eQTLs studies, the expression trait is the RNA level of the gene correlated with the eQTL.
For the eQTL in the row 6 (10:91005952) the expression trait is the RNA level of the LIPA gene.
The summary statistics inform about the significance, the magnitude (the value effect size) and the direction (the sign of the effect size) of the association between the eQTL and the expression trait.
The significance can be expressed in different ways in the eQTLs studies; e.g. with the p-value, the False Discovery Rate (FDR) and the Bayes Factors. A result has statistical significance when it is very unlikely to have occurred by chance. FDR is a method that considers designed for situations in which multiple tests are performed: in the case of the eQTLs studies, thousands of genes are tested for the association with thousands of genetic variants. In particular FDR controls the expected proportion of results that are false and estimates the number of false positives. FDR lower than 5% is a widely used significance level for multiple testing experiments.
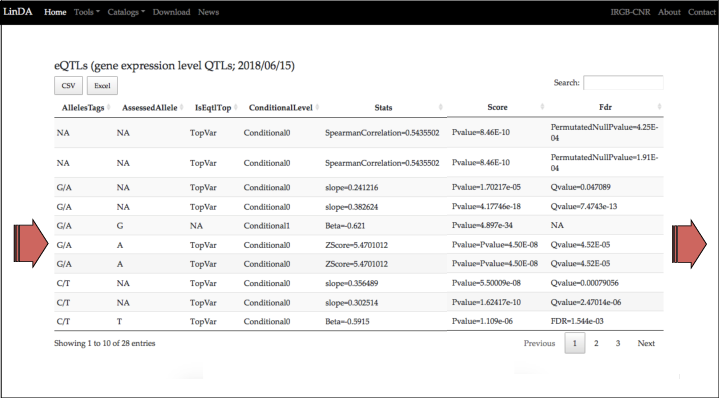
In the row number 6 are reported the summary statistics for 10:91005952. It has a p-value of 4.50E-08 and, more important, a FDR lower than 0.05 (4.52E-05).
The effect size of the association is reported in z-scores and is negative (z-score=5.4701012). The sign of the effect size is referred to the assessed allele: in this case, 10:91005952 has two alleles, G and A, and the assessed allele is A. This can be interpreted as follows: the allele A is associated with the increase of the RNA level of the LIPA gene (in the whole blood of healthy individuals).
Step 8. Open the Pairwise Variants Browser
Question: is the CAD risk associated with an increment (or a decrement) of the LIPA RNA level ?
Thus far we learned that the variant rs1412444 (10:91002927) has two alleles (C and T) and that T is associated with an increased risk of CAD.
Furthermore, rs1412444 (10:91002927) is in LD with the variant 10:91005952, an eQTL for the LIPA gene. 10:91005952 has two alleles (G and A) and the G allele is associated with the decrease of the RNA level of the LIPA gene.
To answer to the question above we need to know whether the T allele of rs1412444 (10:91002927) resides more frequently in the same haplotype of the G (or the A) allele of 10:91005952 in the human population of interest.
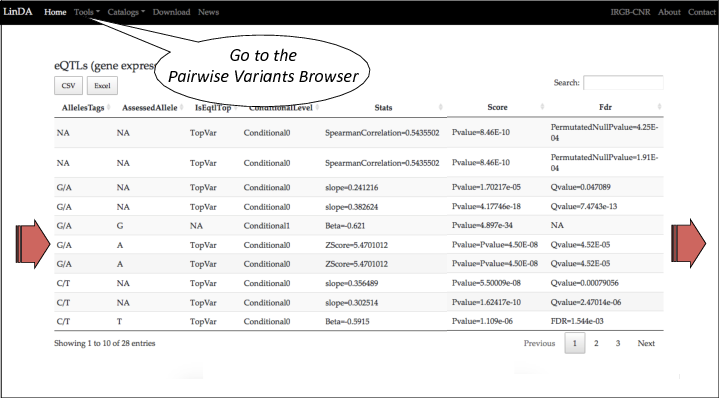
To do this we need more information about the LD, and we will open the Pairwise Variant Browser. This an be opened from the home page or from the Tool section in the top of each web page of LinDA.
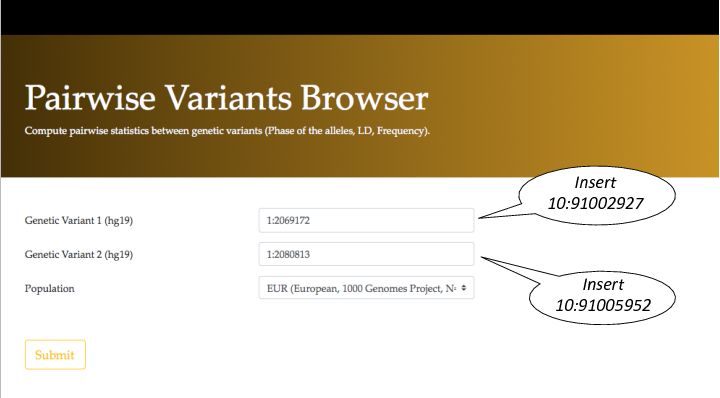
Insert the two variants to be analyzed: 10:91002927 and 10:91005952.
Keep the the defaul population: the european population.
Click on the Submit button to submit the query.
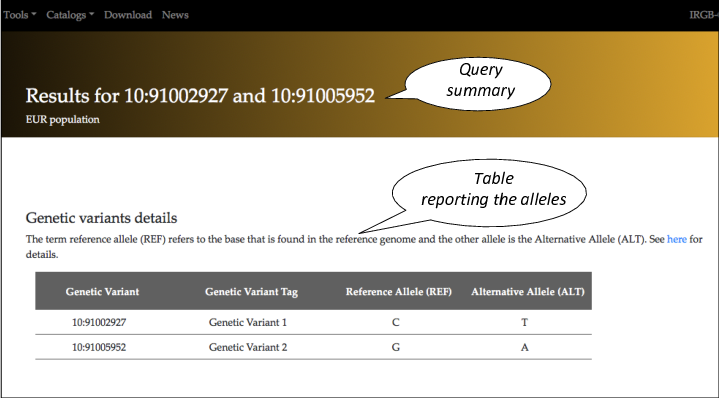
On the top of the page there is the summary of the query.
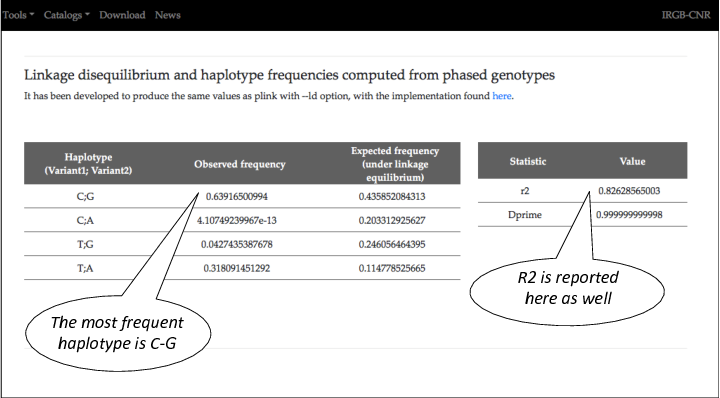
The first table outputted is the name of the alleles for the two variant supplied in the query. The term reference allele (REF) refers to the base that is found in the reference genome and the other allele is the Alternative Allele (ALT).
Scroll down the page to see the other results.
The most frequent haplotype has the allele C (of the CAD GWAS variant) and the allele G ( of the eQTL).
Thus the allele T of the CAD GWAS usually resides in the same haplotype with the allel A of the eQTL.
We conclude that the increased risk for CAD is associated with an increased level of LIPA RNA (in the whole blood of healthy individuals).